Short Answer
Key Formula / Key Facts Box
Pump Performance Curve – Key Facts
| Parameter | Symbol | US Unit | SI Unit | Plain‑English Meaning |
|---|---|---|---|---|
| Flow Rate | Q | gpm (US gal/min) | m³/h, L/s | Volume of liquid moved per unit time |
| Total Dynamic Head | H | ft | m | Energy added to the liquid by the pump |
| Pump Efficiency | η | % | % | Ratio of hydraulic power output to shaft power input |
| Brake Horsepower | BHP / Ps | hp | kW | Mechanical power required at the pump shaft |
| Net Positive Suction Head Required | NPSHr | ft | m | Minimum suction pressure needed to avoid cavitation |
Governing Equation (Hydraulic Power): Phyd = Q × H × SG / 3960 (US: hp, gpm, ft) | Phyd = Q × H × SG / 367 (SI: kW, m³/h, m)
Overview — What It Is and Why It Matters
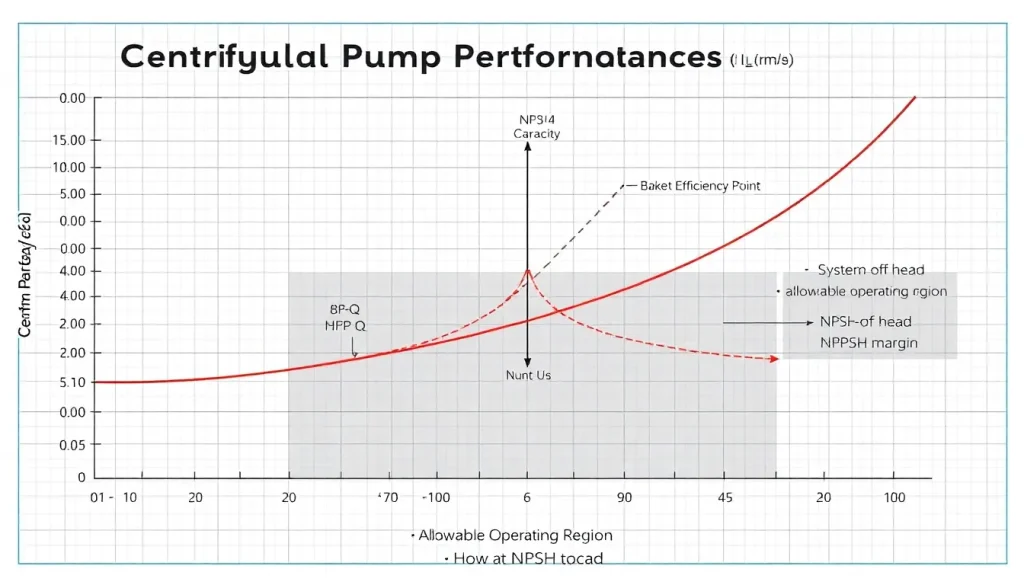
A pump performance curve is a graphical representation of how a centrifugal pump behaves under steady‑state conditions at a given impeller diameter and rotational speed. It is the manufacturer’s signature of the pump’s capability, typically plotting total dynamic head (H), efficiency (η), brake horsepower (BHP), and net positive suction head required (NPSHr) against flow rate (Q). Some curves also include iso‑efficiency contours for multiple impeller trims or speeds.
Physically, the curve captures the pump’s energy transfer: as flow increases, the head developed by a centrifugal pump generally decreases due to hydraulic losses and changes in velocity triangles. The efficiency peaks at the Best Efficiency Point (BEP), where the pump operates with minimal internal losses. To the left of BEP, recirculation and shock losses dominate; to the right, friction and separation losses increase. Understanding this shape is critical for proper pump selection, system integration, and troubleshooting.
Misreading a pump curve can lead to undersized pumps that fail to deliver required flow, oversized pumps that operate far from BEP and waste energy, or catastrophic cavitation when available NPSH falls below NPSHr. In industrial settings, a pump operating continuously at 60% of BEP flow can consume 20–40% more energy per gallon pumped than one correctly sized. The curve is thus the primary tool for matching a pump to its hydraulic system and ensuring reliable, efficient operation.
The Method — How to Read a Pump Curve and Variants
A standard centrifugal pump performance curve is a composite chart. The horizontal axis always represents flow rate (capacity), while the vertical axis can represent several different parameters. The most common layout stacks multiple graphs vertically, all sharing the same flow axis.
1. Head‑Capacity Curve (H–Q)
The primary curve shows the relationship between total dynamic head (H) and flow rate (Q). It typically slopes downward from a maximum “shut‑off head” at zero flow to a minimum at maximum flow. The shape indicates the pump’s stability: a continuously falling curve is stable, while a curve with a “dip” (sometimes called a saddle) can cause unstable operation in parallel pumping. The curve is generated by the manufacturer through testing at constant speed with water, following standards such as ANSI/HI 14.6 or ISO 9906.
2. Efficiency Curve (η–Q)
Efficiency is plotted on the same flow axis, usually as a separate line or overlaid on the head‑capacity curve. It rises from zero at shut‑off, peaks at BEP, and then declines. The BEP flow is the design point where hydraulic, volumetric, and mechanical losses are balanced. Pumps are typically selected to operate within 80–110% of BEP flow for long‑term reliability (ANSI/HI 9.6.3).
3. Power Curve (BHP–Q)
Brake horsepower increases with flow for most centrifugal pumps (radial and mixed flow), but for axial‑flow pumps it may be highest at shut‑off. The power curve is essential for motor sizing: the motor must be rated to cover the entire operating range without overload. In US units, BHP = (Q × H × SG) / (3960 × η). In SI, Ps = (Q × H × SG) / (367 × η) with Q in m³/h, H in m, and Ps in kW.
4. NPSH Required Curve (NPSHr–Q)
NPSHr is the minimum suction pressure needed at the pump inlet to prevent cavitation. It increases with flow, often exponentially at higher flows. The system’s available NPSH (NPSHa) must exceed NPSHr by a safety margin (typically 1–3 ft or 0.3–1 m, or a factor of 1.1–2.5 depending on service and standard). The curve is critical for avoiding cavitation damage.
5. Variants: Multiple Trim / Speed Curves
Manufacturers often provide composite curves showing performance for several impeller diameters (trimmed) or speeds (VFD operation). Iso‑efficiency contours help select the best trim for a given duty point. When reading these, always note the impeller diameter or speed label on each curve.
6. System Curve Overlay
Although not part of the pump curve, the system curve (Hsys = Hstatic + KQ²) is often plotted on the same graph. The intersection of the system curve and the pump H–Q curve defines the operating point. This is the practical method for verifying that the pump will deliver the required flow against the actual system resistance.
Worked Example
Example 1 – US Customary Units
Scenario: A process requires 400 gpm of water (SG=1.0) at 120 ft of total head. A pump curve shows the following at 400 gpm: H=130 ft, η=78%, NPSHr=8 ft. Determine if the pump is suitable, the required motor power, and the NPSH margin if NPSHa=14 ft.
Step 1 – Operating Point: At 400 gpm, the pump delivers 130 ft, which exceeds the required 120 ft. A throttle valve can reduce the head to 120 ft, shifting the operating point leftward on the curve (flow will slightly increase, but for simplicity we assume 400 gpm at 120 ft after throttling).
Step 2 – Power: BHP = (Q × H × SG) / (3960 × η) = (400 × 120 × 1.0) / (3960 × 0.78) = 48,000 / 3088.8 ≈ 15.54 hp. Select a 20 hp motor (next standard size) to allow for overload margin.
Step 3 – NPSH Margin: NPSHa – NPSHr = 14 – 8 = 6 ft. A margin of 6 ft exceeds the typical 3 ft minimum, so cavitation is unlikely.
Example 2 – SI Units
Scenario: A cooling water pump must deliver 90 m³/h at 32 m head. The pump curve shows at 90 m³/h: H=34 m, η=81%, NPSHr=2.8 m. NPSHa calculated as 5.5 m. Determine shaft power and check NPSH margin.
Step 1 – Power: Ps = (Q × H × SG) / (367 × η) = (90 × 32 × 1.0) / (367 × 0.81) = 2880 / 297.27 ≈ 9.69 kW. A 11 kW motor would be appropriate.
Step 2 – NPSH Margin: NPSHa – NPSHr = 5.5 – 2.8 = 2.7 m. This is a safe margin (typically >0.5–1 m). The pump is acceptable.
Calculator
For quick evaluation of pump hydraulic power and efficiency, use the online pump curve calculator at PumpCalcs – Total Dynamic Head & Power. This tool allows you to input flow, head, and efficiency to compute brake horsepower and compare against manufacturer curves.
Reference Values & Typical Ranges
| Parameter | Typical Range | Notes |
|---|---|---|
| Centrifugal pump efficiency (BEP) | 50–92% | Small pumps 90% (HI 20.3) |
| Shut‑off head / BEP head ratio | 1.1–1.5 | Higher for low specific speed pumps |
| NPSHr at BEP (water, end‑suction) | 1–8 m (3–25 ft) | Increases with flow and speed |
| Allowable operating region (ANSI/HI 9.6.3) | 70–120% of BEP flow | Preferred; 50–110% for continuous duty |
| Minimum continuous stable flow | 25–50% of BEP | Below this, recirculation and vibration risk |
| NPSH margin (NPSHa/NPSHr) | 1.1–2.5 (or 0.5–3 m) | Depends on fluid, energy level, and standard |
Sources: Hydraulic Institute Standards (ANSI/HI 14.6, 9.6.1, 9.6.3); ISO 9906:2012; Karassik et al., “Pump Handbook”.
Application Guidance
In real systems, the pump curve is never used in isolation. The actual operating point is the intersection of the pump H–Q curve and the system curve. When selecting a pump, engineers overlay the system curve on the manufacturer’s performance chart to verify that the intersection falls within the allowable operating region (AOR) and preferably near BEP. If the system curve is steep (high static head), a pump with a flat H–Q curve may be needed to avoid large flow variations with small head changes. Conversely, a steep pump curve provides better flow control in systems with mostly friction losses.
For variable‑speed drives, the affinity laws allow prediction of performance at different speeds: Q ∝ N, H ∝ N², P ∝ N³. The pump curve at a new speed can be constructed by scaling the published curve. This is invaluable for energy savings in systems with varying demand.
Field adjustments often involve trimming the impeller to match a duty point. The manufacturer’s curve for a smaller diameter can be estimated using the affinity laws for diameter (Q ∝ D, H ∝ D²), but only within the recommended trim range (typically 70–100% of max diameter) to avoid excessive efficiency loss.
When reading a curve, always check the liquid properties stated (usually water at 20°C). For viscous fluids, the performance must be corrected using the Hydraulic Institute’s viscosity correction charts (ANSI/HI 9.6.7), which reduce head, flow, and efficiency.
Common Mistakes, Limits & Safety Notes
- Ignoring the system curve: Selecting a pump based solely on a single design point without plotting the system curve can result in a pump that operates far from BEP, causing vibration, seal failures, and energy waste.
- Confusing NPSHr with NPSHa: NPSHr is a pump characteristic; NPSHa is a system characteristic. A pump will cavitate if NPSHa < NPSHr + margin. Always calculate NPSHa for the worst‑case condition (high temperature, low tank level).
- Unit mismatches: Mixing US and SI units in power calculations (e.g., using m³/h and ft) leads to gross errors. Always verify the constant (3960 for US, 367 for SI) and unit consistency.
- Overlooking motor sizing: The power curve shows pump input power; the motor must be sized for the maximum power across the entire operating range, not just the design point. For radial pumps, this is usually at the end of the curve.
- Assuming constant efficiency: Efficiency varies significantly with flow. Using BEP efficiency for a part‑load condition overestimates performance and can lead to undersized motors.
- Neglecting NPSH margin for hydrocarbons: Hydrocarbon fluids can require higher NPSH margins due to their thermodynamic properties. Refer to API 610 or HI guidelines.
- Misreading composite curves: When multiple impeller trims are shown, ensure you are reading the correct curve for the installed diameter. A 0.125‑inch trim difference can shift the curve noticeably.
- Safety – Cavitation damage: Operating with insufficient NPSH margin causes pitting, noise, and eventual impeller destruction. In high‑energy pumps, cavitation can lead to catastrophic failure within hours.
- Safety – Runout operation: Operating at extremely low head (runout) can overload the motor and cause excessive vibration. Always ensure the system resistance prevents the pump from running beyond its published curve.
- Limits of the curve: The curve is valid only for the stated speed, impeller diameter, and fluid (usually water). Extrapolating beyond the tested range is unreliable and unsafe.
FAQ
What is the most important line on a pump curve?
The head-capacity (H-Q) curve is the most fundamental because it shows how much pressure the pump can generate at a given flow. However, the efficiency and NPSHr curves are equally critical for ensuring energy-efficient and cavitation-free operation. Always consider all curves together.
How do I find the operating point of a pump?
The operating point is the intersection of the pump’s H-Q curve and the system curve. Plot the system head requirement (static head plus friction losses) against flow on the same graph. The flow and head at the crossing point are what the pump will actually deliver.
What does a flat pump curve mean?
A flat H-Q curve means the head changes very little over a wide flow range. This is typical of high-specific-speed pumps. It provides stable pressure but can cause large flow swings with small system changes. Steep curves offer better flow control.
Why does efficiency drop at low flow?
At low flow, recirculation and shock losses inside the impeller and volute increase significantly. The pump also experiences higher disc friction losses relative to the useful hydraulic power. Efficiency naturally peaks at BEP where these losses are balanced.
What is the difference between NPSHr and NPSHa?
NPSHr (required) is a pump characteristic provided by the manufacturer; it is the minimum suction head needed to prevent cavitation. NPSHa (available) is calculated from the system’s suction piping and fluid properties. NPSHa must exceed NPSHr by a safety margin.
Can I use a pump curve for a different impeller size?
Only if the manufacturer provides a curve for that specific trimmed diameter, or you can apply the affinity laws within the recommended trim range (typically down to 70% of max diameter). Trimming beyond that range causes significant efficiency loss and is not recommended.
How does viscosity affect the pump curve?
Viscous liquids reduce head, flow, and efficiency compared to water. The Hydraulic Institute publishes correction factors (ANSI/HI 9.6.7) that must be applied to the water-based curve. High viscosity can shift the BEP to a lower flow and increase power consumption.
What is runout on a pump curve?
Runout is the point at the far right of the H-Q curve where the head is minimal and flow is maximum. Operating at runout can overload the motor and cause excessive vibration. It should be avoided unless the pump is specifically designed for such conditions.
Leave a Reply