Short Answer
Key Formula / Key Facts Box
Overall Efficiency (η_o)
η_o = η_h × η_v × η_m
| Symbol | Meaning | US Unit | SI Unit |
|---|---|---|---|
| η_h | Hydraulic efficiency | — | — |
| η_v | Volumetric efficiency | — | — |
| η_m | Mechanical efficiency | — | — |
| Q | Volumetric flow rate | gpm | m³/s |
| ΔP | Differential pressure (head) | psi | Pa |
| P_shaft | Shaft power supplied | hp | kW |
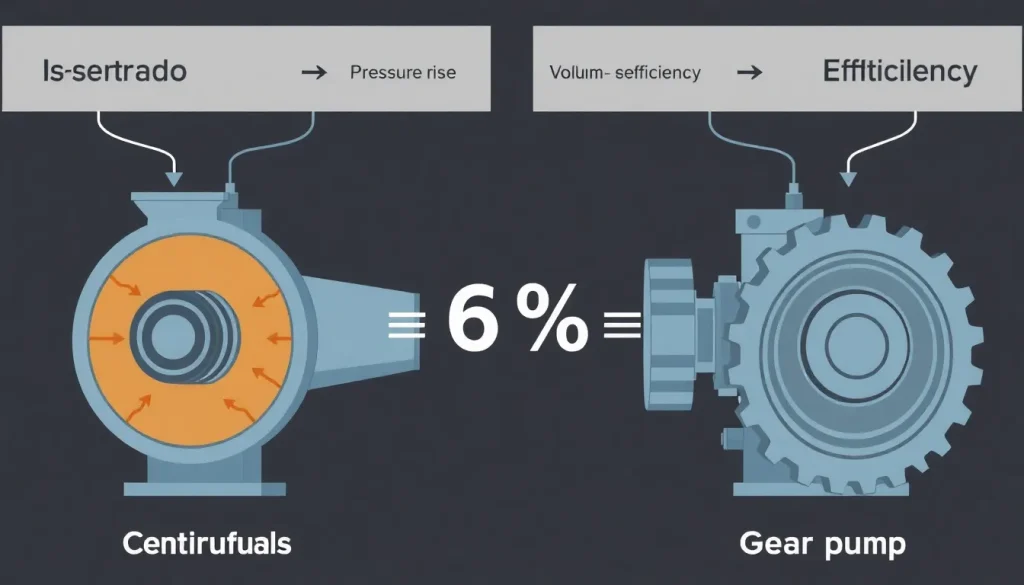
In plain English: the overall pump efficiency equals the product of how well the pump converts shaft power to fluid power (hydraulic), how well it avoids internal leakage (volumetric), and how little mechanical loss it suffers (mechanical).
Overview — What It Is and Why It Matters
Pump efficiency quantifies the ratio of useful energy transferred to the fluid versus the energy supplied to the pump’s shaft. It is split into three fundamental components:
- Hydraulic efficiency (η_h) – measures how closely the pump’s generated head matches the theoretical head for a given flow.
- Volumetric efficiency (η_v) – accounts for internal leakage that reduces the net displaced volume.
- Mechanical efficiency (η_m) – reflects frictional and windage losses in bearings, seals, and the motor‑pump coupling.
The product of these three yields the overall efficiency, which directly influences operating cost, pump sizing, and system reliability. Over‑estimating efficiency can lead to undersized motors, excessive heat, premature seal failure, and higher electricity bills.
The Method — Derivation and Variants
Hydraulic efficiency derives from the energy balance between fluid power and shaft power:
η_h = (Q·ΔP) / P_shaft
where Q·ΔP represents the ideal fluid power (flow × pressure rise). In US units:
η_h = (Q [gpm] × ΔP [psi] × 3960) / (P_shaft [hp] × 550)
and in SI units:
η_h = (Q [m³/s] × ΔP [Pa]) / P_shaft [W]
Volumetric efficiency compares the actual flow to the theoretical displacement per revolution (V_d):
η_v = Q_actual / (V_d × N)
where N is rotational speed (rpm). The SI form replaces V_d in m³/rev and N in rev/s.
Mechanical efficiency is the ratio of shaft power delivered to the motor versus the power absorbed by the pump’s rotating assembly:
η_m = P_shaft / (P_shaft + P_friction)
Frictional power can be estimated from bearing data or measured with a torque transducer.
When all three efficiencies are expressed as decimals (0‑1), the overall efficiency is simply their product. Some standards (e.g., API 610) report a single “overall efficiency” curve that already incorporates typical η_v and η_m values for a given pump family.
Worked Example
Example 1 – US Customary Units (Centrifugal Pump)
- Given: Q = 500 gpm, ΔP = 120 psi, shaft power = 45 hp.
- Hydraulic efficiency: η_h = (500 × 120 × 3960) / (45 × 550) = (237,600,000) / 24,750 ≈ 0.96 → 96 %.
- Assume measured leakage reduces flow by 3 % → η_v = 0.97.
- Measured bearing torque indicates 5 % mechanical loss → η_m = 0.95.
- Overall efficiency: η_o = 0.96 × 0.97 × 0.95 ≈ 0.885 → 88.5 %.
Example 2 – SI Units (Positive‑Displacement Gear Pump)
- Given: Q = 0.025 m³/s, ΔP = 1.2 MPa, shaft power = 30 kW.
- Hydraulic efficiency: η_h = (0.025 × 1.2×10⁶) / 30,000 = 30,000 / 30,000 = 1.00 → 100 % (idealized).
- Leakage measured at 2 % of theoretical displacement → η_v = 0.98.
- Mechanical losses from bearing charts = 4 % → η_m = 0.96.
- Overall efficiency: η_o = 1.00 × 0.98 × 0.96 = 0.941 → 94.1 %.
Calculator
For quick calculations, use the online tool: Pump Efficiency Calculator.
Reference Values & Typical Ranges
- Hydraulic efficiency: 70 %–95 % for centrifugal pumps; 85 %–98 % for positive‑displacement pumps (ISO 5199).
- Volumetric efficiency: 80 %–99 % depending on clearances and fluid viscosity (API 610).
- Mechanical efficiency: 85 %–98 % for well‑lubricated bearings; lower for high‑speed or poorly aligned units.
- Overall efficiency: 60 %–85 % typical for large‑scale centrifugal pumps; 80 %–95 % for gear or screw pumps.
Source: ANSI/HI 9.6‑2009, ISO 5199, API 610.
Application Guidance
When selecting a pump, use the efficiency curves supplied by the manufacturer to size the motor correctly. For variable‑flow applications, consider a pump with a flat η_h curve across the intended operating range. In high‑viscosity fluids, prioritize volumetric efficiency by selecting tight‑tolerance clearances or a progressive cavity design. Mechanical efficiency can be improved with low‑friction bearings, proper alignment, and regular lubrication.
Common Mistakes, Limits & Safety Notes
- Mixing US and SI units in the same calculation – always convert before substituting.
- Assuming η_h × η_v × η_m = manufacturer‑quoted overall efficiency without accounting for curve‑specific conditions.
- Neglecting temperature effects on viscosity, which can degrade η_v by several percent.
- Using overall efficiency to predict motor power for start‑up conditions – transient losses are higher.
- Over‑looking seal leakage; a small internal leak can reduce η_v dramatically in low‑flow pumps.
- Ignoring safety factors; operating a pump at the edge of its efficiency curve can cause cavitation and premature wear.
FAQ
Why does a pump’s overall efficiency rarely exceed 95 %?
Because each efficiency component (hydraulic, volumetric, mechanical) incurs unavoidable losses – pressure drops, internal leakage, and friction – which multiply together, capping the overall value well below 100 %.
Can I use the same efficiency curve for water and oil?
No. Viscosity and density affect volumetric and hydraulic efficiencies. Manufacturers usually provide separate curves for different fluid families; using the water curve for oil will over‑predict performance.
How often should I re‑measure pump efficiency?
At least once per major maintenance interval (typically every 2‑3 years) or after any significant change in operating conditions, such as a new fluid or altered flow rate.
What is the impact of bearing wear on mechanical efficiency?
Worn bearings increase friction, raising the mechanical loss fraction. A 0.5 % drop in η_m can translate to a 5‑10 % increase in motor electricity consumption for large pumps.
Is it acceptable to size a motor based on peak efficiency rather than design point?
Sizing on peak efficiency can lead to under‑powered motors at off‑design conditions where efficiency falls. Design for the expected operating point or include a safety margin of 10‑15 %.
Do variable‑speed drives improve overall pump efficiency?
VSDs allow the pump to operate closer to its best‑efficiency point across a range of flows, often raising the system‑wide efficiency by 5‑15 % compared to a fixed‑speed pump running far off‑design.
Leave a Reply