Short Answer
Key Formula / Key Facts Box
Governing formula for a pump upstream of pretreatment: Hp = (PRO − Ps)/(ρ g) + Δz + hf,pretreat + hf,piping + hvel
US customary: Hp (ft) = 2.31 × (PRO − Ps)/SG + Δz + hf,pretreat + hf,piping + hvel
SI: Hp (m) = 10.197 × (PRO − Ps)/SG + Δz + hf,pretreat + hf,piping + hvel
| Symbol | Meaning | US unit | SI unit |
|---|---|---|---|
| Hp | Total pump head at the design flow | ft | m |
| PRO | Required pressure at the RO membrane inlet, including osmotic and net driving pressure from the membrane design | psi | bar |
| Ps | Available suction pressure at the pump inlet | psi | bar |
| SG | Specific gravity of the feed water relative to water at 4 °C | dimensionless | dimensionless |
| Δz | Elevation change from pump suction to RO inlet | ft | m |
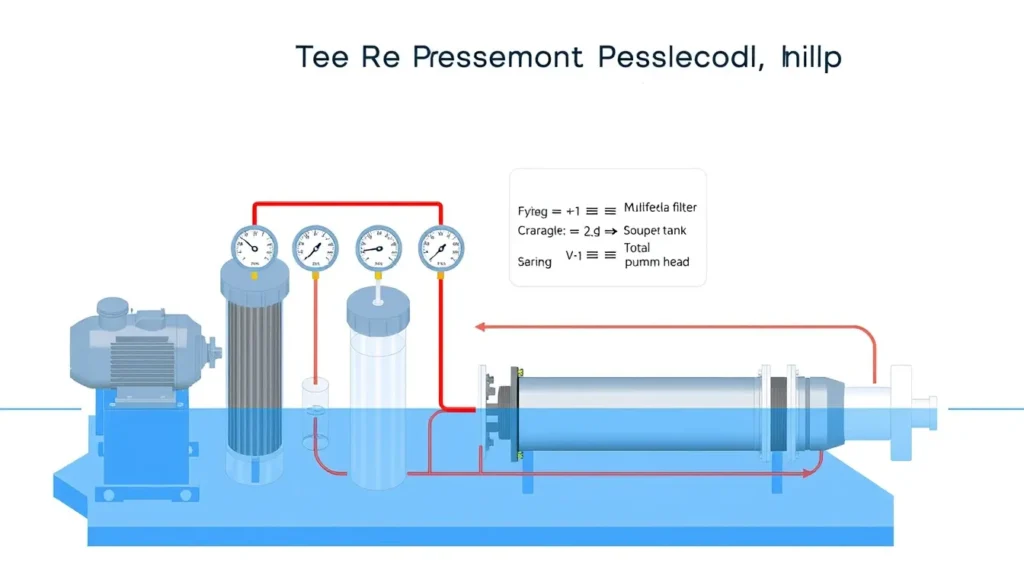
| hf,pretreat | Sum of pretreatment pressure losses expressed as head, such as multimedia, carbon, cartridge, and UF filters | ft | m |
| hf,piping | Pipe, fitting, valve, and control-valve losses expressed as head | ft | m |
| hvel | Velocity head difference between discharge and suction | ft | m |
Plain-English restatement: The pump must supply enough head to reach the required RO inlet pressure, lift the water, and push it through pretreatment, piping, and valves, after crediting any pressure already present at suction.

Overview — What It Is and Why It Matters
RO feed pump head is the hydraulic energy per unit weight that the feed pump must add to move water from its suction source to the reverse-osmosis membrane inlet at the design flow and pressure. In many RO systems, the feed pump is the high-pressure pump that establishes the pressure needed for permeate production. In other configurations, a booster pump supplies pretreated water to a separate high-pressure pump, or a single feed pump pushes water through pretreatment and then to the membrane. The calculation boundary must be stated clearly because pretreatment losses are added when the pump is upstream of the filters, but they reduce available suction pressure when the pump is downstream of the filters.
This article explains how to calculate RO feed pump head with pretreatment losses for the common case in which the pump must overcome the cartridge filter, carbon filter, multimedia filter, ultrafiltration stage, or other pretreatment resistance before the water reaches the membrane. Pretreatment is essential for controlling particulate, colloidal, organic, and biological fouling, but every pretreatment stage consumes pressure. If those losses are ignored, the pump may be undersized, permeate flow may fall below design, membrane recovery may become unstable, and the operator may mistakenly blame the membrane or pretreatment when the real issue is pump head.
Excessive head margin is also a problem. Oversizing the feed pump can cause throttling, operation away from the best efficiency point, higher energy consumption, overpressure risk, and unnecessary stress on cartridges and membrane elements. Accurate head calculation therefore supports reliable production, stable salt rejection, reasonable energy use, and proper pump selection. The calculation is part of system design, not merely a pump-catalogue exercise.
The Method — Derivation and Variants
The calculation follows the steady-flow energy equation. Between the pump suction flange and the RO inlet, the pump head equals the change in pressure head plus the change in elevation head plus the change in velocity head plus all hydraulic losses. Written in general form, Hp = (Pd − Ps)/(ρg) + (vd2 − vs2)/(2g) + (zd − zs) + hL. For an RO feed pump, the discharge pressure Pd is normally the membrane supplier’s required feed pressure PRO, and hL includes pretreatment, piping, fittings, valves, and any control valve or flow element losses. The velocity head term is often small, but it should be included when suction and discharge pipe sizes differ significantly.
In US customary form, pressure in psi is converted to feet of water using 2.31 ft per psi at specific gravity 1.0. The working equation is Hp (ft) = 2.31 × (PRO − Ps)/SG + Δz + hf,pretreat + hf,piping + hvel. The constant 2.31 comes from the weight of a 1-square-inch column of water one foot high. In SI form, 1 bar equals approximately 10.197 m of water at SG 1.0, so Hp (m) = 10.197 × (PRO − Ps)/SG + Δz + hf,pretreat + hf,piping + hvel. Divide by SG for fluids other than water; RO feed water is usually close to 1.0, but brackish or seawater calculations should use the actual density.
Pretreatment losses can be obtained from vendor pressure-drop curves, differential-pressure gauges, or hydraulic calculations. A critical variant is clean versus dirty operation. Multimedia and carbon filters may show 0.3 to 0.8 bar clean pressure drop but 0.8 to 1.5 bar when loaded; cartridge filters may rise to 0.8 to 1.5 bar before changeout. For dependable design, use the maximum expected dirty pressure drop or add a stated design margin to the clean value. Do not add pretreatment losses twice: if the pump takes suction downstream of the filters, the suction pressure is already reduced by those losses, so hf,pretreat is not added again. Likewise, if PRO already includes osmotic pressure and net driving pressure, do not add osmotic pressure separately.
Worked Example
SI example. A brackish-water RO train produces 50 m³/h of permeate at 75% recovery, so the feed flow is about Qfeed = 50/0.75 = 66.7 m³/h. The membrane design requires PRO = 15 bar at the RO inlet. The pump takes suction from a tank at Ps = 0.5 bar, so the available suction pressure is low. The feed specific gravity is 1.00, and the RO inlet is Δz = 4 m above the pump suction. At the design dirty-filter condition, pretreatment losses are multimedia 0.6 bar, activated carbon 0.5 bar, cartridge filter 0.5 bar, and ultrafiltration 0.8 bar, totaling 2.4 bar. Converted to head, 2.4 × 10.197 = 24.47 m. Piping, fittings, and valve losses are estimated at 0.8 bar, or 8.16 m. Velocity head difference is 0.2 m. Substitute into the SI equation: Hp = 10.197 × (15 − 0.5)/1.00 + 4 + 24.47 + 8.16 + 0.2 = 147.86 + 4 + 24.47 + 8.16 + 0.2 = 184.69 m. The pump duty is therefore about 185 m at 66.7 m³/h, equivalent to roughly 18.1 bar differential pressure.
US example. An RO feed pump must deliver PRO = 200 psi at the membrane inlet. Available suction pressure is Ps = 20 psi, specific gravity is 1.02, and elevation rise is Δz = 20 ft. Dirty pretreatment loss is 45 ft, piping and valve loss is 18 ft, and velocity head difference is 1.5 ft. Use the US equation: Hp = 2.31 × (200 − 20)/1.02 + 20 + 45 + 18 + 1.5. The pressure term is 2.31 × 180/1.02 = 407.65 ft. Adding elevation and losses gives 407.65 + 20 + 45 + 18 + 1.5 = 492.15 ft. The pump must produce about 492 ft at design flow, which corresponds to a differential pressure of approximately 492 × 1.02/2.31 ≈ 217 psi.
Calculator
For a quick total-dynamic-head check, use an online Total Dynamic Head Calculator. Enter the design flow, suction pressure, discharge pressure or required RO inlet pressure, elevation difference, and sum of pretreatment and piping losses in consistent units. For membrane feed pressure, use the RO membrane manufacturer’s projection software or design sheet; for pretreatment pressure drop, use vendor curves and field differential-pressure readings. The calculator is only an aid: the engineer must confirm the system boundary, clean versus dirty filter conditions, specific gravity, and whether pretreatment losses are already reflected in suction pressure.
Reference Values & Typical Ranges
| Parameter | Typical range | Practical note |
|---|---|---|
| Multimedia filter pressure drop | 0.3–0.8 bar clean; 0.8–1.5 bar loaded | Use loaded value for design; confirm with backwash data and vendor limits. |
| Activated carbon filter pressure drop | 0.3–0.7 bar clean; up to 1.0–1.5 bar loaded | Carbon may also adsorb organics and affect fouling; monitor differential pressure. |
| Cartridge filter pressure drop | 0.2–0.5 bar clean; 0.8–1.5 bar at changeout | Often the final pretreatment barrier before the RO feed pump or membrane. |
| Ultrafiltration pressure drop | 0.5–1.5 bar | Depends on flux, fouling, and backwash condition; use design dirty value. |
| Piping and valve losses | 0.3–1.0 bar typical; higher for long runs or throttling valves | Calculate by Darcy–Weisbach or use a conservative system estimate. |
| BWRO membrane feed pressure | 10–25 bar | Depends on feed TDS, recovery, temperature, and membrane type. |
| SWRO membrane feed pressure | 55–70 bar | Energy-recovery devices are common; use actual membrane design data. |
| Osmotic pressure rule of thumb | ≈0.08 bar per 1000 ppm TDS | Use ionic composition and membrane software for final design. |
| Design margin on losses | 10–20% or use maximum dirty ΔP | Do not double count margin and dirty-filter allowance. |
| Suction velocity target | <1.5 m/s | Protects NPSH margin and reduces suction loss. |
Typical values should be treated as screening guidance, not final design. The IWA pretreatment and RO process-design chapters emphasize that fouling and filter loading change hydraulic resistance, so the feed pressure required to maintain capacity rises as membranes foul and filters load. Membrane suppliers and pretreatment vendors should provide the project-specific values used for pump selection.
Application Guidance
In real RO systems, feed pump head is not a fixed number. Pretreatment pressure drop rises between backwashes and cartridge changes, suction tank level may fall, feed temperature changes viscosity and membrane flux, and flow may be adjusted by a variable-frequency drive or control valve. A pump selected only at the clean-filter condition may operate acceptably on commissioning day but fail to hold design permeate flow once filters load. A pump selected with excessive margin may operate far back on its curve, wasting energy and requiring throttling that can increase vibration and wear. The practical approach is to define the design flow, the maximum dirty pretreatment pressure drop, the minimum available suction pressure, and the maximum elevation difference, then locate the duty point on the pump curve near the best efficiency region.
Instrumentation supports the calculation and ongoing verification. Differential-pressure gauges across each pretreatment stage show when losses are approaching the design allowance. Pressure gauges at pump suction and discharge, plus a flow meter, allow the operator to compare actual head with the calculated value. NPSH must be checked separately: insufficient suction pressure can cause cavitation even when the discharge head calculation appears correct. For variable-flow operation, confirm that the pump can operate across the expected range without excessive internal recirculation. Motor power should be checked from Pshaft = ρgQH/η, using the design flow, head, and pump efficiency, then applying a motor and service-factor margin.
Common Mistakes, Limits & Safety Notes
- Omitting pretreatment losses. Using only membrane pressure and piping loss leaves out the multimedia, carbon, cartridge, or UF resistance, so the pump is undersized.
- Using clean-filter pressure drop for design. Clean ΔP is useful for commissioning checks, but design should use the maximum dirty ΔP or a clearly stated allowance.
- Double-counting pretreatment. If the pump takes suction downstream of the filters, the suction pressure already includes the filter loss; do not add hf,pretreat again.
- Adding osmotic pressure twice. Membrane feed pressure PRO normally already includes osmotic and net driving pressure; add it only when building PRO from first principles.
- Mixing units. Do not combine bar with metres, psi with feet, or pressure losses in kPa with a formula expecting bar or psi. Convert every term to the same head unit before summing.
- Forgetting specific gravity. The constants 2.31 and 10.197 assume water at SG 1.0; brackish and seawater duties require division by actual SG.
- Ignoring suction variation and NPSH. Low tank level, clogged suction strainers, or high temperature can reduce available NPSH and cause cavitation, seal damage, and unstable flow.
- Adding arbitrary oversizing margin. Excessive margin can cause throttling, overpressure, energy waste, and operation away from the pump’s efficient range; use a documented margin instead.
- Neglecting safety devices. Provide relief protection, high-pressure interlocks, and deadhead protection where the pump can be isolated. Check that shutoff head does not exceed cartridge, piping, or membrane pressure ratings.
Limit of method: This steady-state head calculation does not replace transient surge analysis, NPSH analysis, or membrane manufacturer software. It is a design and troubleshooting tool that must be updated when filter condition, recovery, temperature, or feed salinity changes.
FAQ
How do I calculate RO feed pump head with pretreatment losses?
Convert the required membrane inlet pressure and available suction pressure to head, subtract suction head, then add elevation, pretreatment pressure drop, piping losses, and velocity head. Use dirty-filter pressure drop for design. Keep all terms in metres or feet before selecting the pump.
Should I use clean or dirty filter pressure drop for pump sizing?
Design should use the maximum expected dirty-filter pressure drop, because filters load between backwashes or cartridge changes. Clean pressure drop is useful for commissioning checks, but sizing on clean values can leave the pump unable to hold design permeate flow later in the run.
What is the difference between an RO booster pump and a high-pressure feed pump?
A booster pump typically supplies feed water through pretreatment or maintains upstream pressure, while the high-pressure RO feed pump provides the much higher pressure needed for membrane separation. Some systems combine these duties, so define the pump boundary before adding pretreatment losses.
How do I convert bar to meters of head for RO pump calculations?
Multiply bar by approximately 10.197 to get metres of water head at specific gravity 1.0. For other specific gravities, divide by SG. For example, 2 bar of pressure loss is about 20.4 m of head in water.
How much design margin should I add to RO feed pump head?
A common allowance is 10–20% on estimated losses, or simply use the maximum dirty-filter pressure drop. Avoid stacking a large arbitrary margin on top of dirty-filter values, because excessive margin can cause throttling, overpressure, and poor pump efficiency.
Can I ignore velocity head and elevation in RO feed pump calculations?
Elevation should not be ignored when the membrane is significantly above or below the pump. Velocity head is often small, but include it when suction and discharge pipe sizes differ. For short, equal-size runs it may be negligible compared with membrane pressure and filter losses.
Why does feed temperature affect RO feed pump head?
Temperature changes water viscosity, membrane flux, and osmotic pressure. Warmer feed usually lowers viscosity and reduces required pressure, while colder feed increases viscosity and can raise pressure drop. Membrane manufacturers publish temperature correction factors that should be used in design.
What happens if the RO feed pump head is undersized?
An undersized pump may not reach design permeate flow, especially as filters load or membranes foul. Operators may see low recovery, unstable salt rejection, and increased cleaning frequency. The pump may also run far out on its curve, causing overload or cavitation risk.
How do I check NPSH for an RO feed pump?
Calculate available NPSH from suction pressure, tank level, suction losses, and vapour pressure, then compare it with the pump’s required NPSH at the design flow. Use the minimum expected tank level and maximum temperature. Insufficient NPSH margin can cause cavitation and seal damage.
Do I add osmotic pressure separately if I know the membrane feed pressure?
No. If the membrane supplier’s required feed pressure already includes osmotic pressure and net driving pressure, adding osmotic pressure again double-counts it. Add osmotic pressure separately only when you are building the required membrane feed pressure from first principles.
Leave a Reply