
Short Answer
Key Formula / Key Facts Box
Steady-state availability: A = MTBF / (MTBF + MTTR) = Uptime / (Uptime + Downtime)
Exponential reliability: R(t) = e−t/MTBF = e−λt, where λ = 1/MTBF
| Symbol | Meaning | US unit | SI unit |
|---|---|---|---|
| A | Availability, fraction or percent of required time ready to run | unitless or % | unitless or % |
| MTBF | Mean time between functional failures | hours | hours or seconds |
| MTTR | Mean time to repair and restore function | hours | hours or seconds |
| Uptime | Time the pump is able to perform its required function | hours | hours or seconds |
| Downtime | Time the pump is not able to perform its required function | hours | hours or seconds |
| R(t) | Probability of surviving without functional failure to time t | unitless | unitless |
| t | Mission time or interval of interest | hours | hours or seconds |
| λ | Failure rate, equal to 1/MTBF for constant-rate service | failures/hour | 1/hour or 1/second |
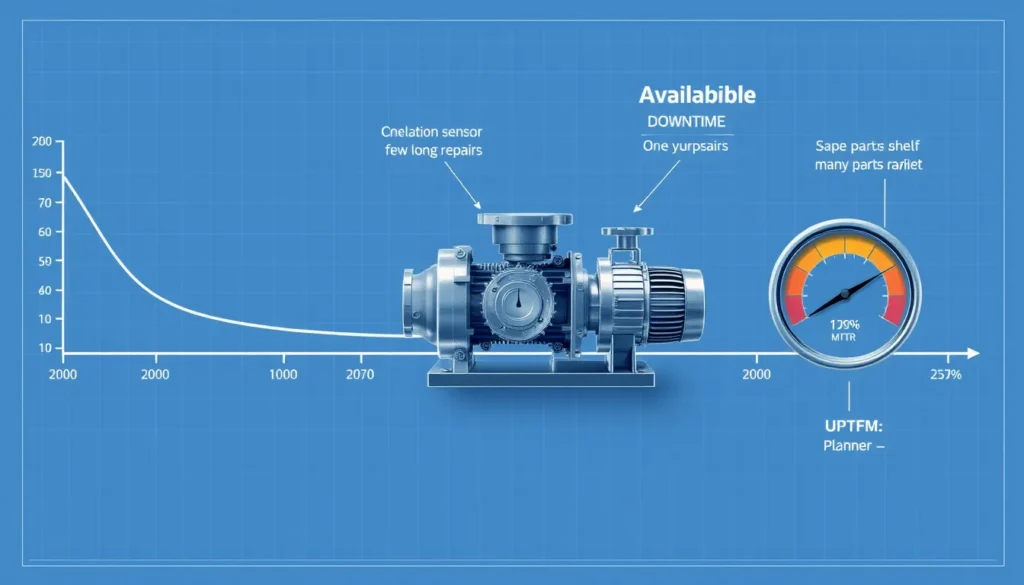
Plain-English restatement: Availability asks how much of the required time the pump is ready to run; reliability asks how long it is likely to run before the next functional failure.
Overview — What It Is and Why It Matters
In this article, availability and reliability are treated as asset-management metrics for industrial pumps, not as available NPSH, spare-parts availability, or hydraulic availability. The phrase Pump Availability vs Reliability: Why Fewer Repairs Is Only Part of the Story captures a central maintenance-engineering distinction: reliability is about failure frequency and survival time, while availability is about readiness and uptime within a defined operating window.

Reliability is the ability of a pump to perform its required function for a stated period under stated conditions. In practice, it is measured by failure intervals such as mean time between failures, MTBF, or by a survival probability such as R(t). Availability is the fraction of required time that the pump is able to perform its function. It includes both how often the pump fails and how quickly it is restored after failure or planned maintenance. A pump can be highly reliable but have poor availability if repairs take weeks because spares are missing or maintenance access is difficult. Conversely, a pump can show high availability while failing frequently, provided each interruption is short.
The engineering relevance is direct: pumps are often critical process assets, and downtime can cost far more than the pump itself. Life-cycle cost studies commonly show maintenance as a major cost component after energy, so reliability and availability data are used to justify spare-parts strategies, condition monitoring, and reliability-centered maintenance. The common error is to treat fewer repairs as proof of improved availability. Fewer repairs may raise MTBF, but availability also depends on repair duration, logistics, planned shutdowns, and the definition of functional failure.
The Method — Derivation and Variants
For a repairable pump observed over a defined required-time period T, let D be total downtime and U be uptime. Then U = T − D, and availability is A = U/T = U/(U + D). If the pump has N functional failures in the period, define MTBF = U/N and MTTR = D/N. Substituting gives A = (NMTBF) / (NMTBF + NMTTR) = MTBF/(MTBF + MTTR). This is the steady-state or inherent-availability form for repairable equipment.
Reliability follows from the failure-rate model. If failures occur at a constant rate λ, then MTBF = 1/λ, and the probability of no functional failure by time t is R(t) = e−λt = e−t/MTBF. This exponential form is a first-order approximation. It is reasonable for random failures in the useful-life region, but it is not suitable for strongly wear-out-dominated failures such as bearing fatigue, seal wear, or erosion. For those, Weibull or physics-of-failure models are more appropriate.
US-customary and SI forms are numerically identical when time units are consistent. US practice usually reports MTBF and MTTR in hours, operating hours per year, or days. SI practice may use hours in pump asset management but can also use seconds in laboratory or high-speed reliability work. The key is to keep numerator and denominator in the same unit and to state whether availability is a decimal fraction or a percentage. Planned downtime variants include achieved availability, which includes preventive maintenance, and operational availability, which includes logistics and administrative delays. Operational availability is often written Ao = MTBM/(MTBM + MDT), where MTBM is mean time between maintenance actions and MDT is mean down time.
Worked Example
Example 1 — US customary units. A critical process pump is required for a 720 h quarter. It has 4 functional failures and total repair downtime of 24 h. Assume no planned downtime is included. Step 1: uptime = 720 − 24 = 696 h. Step 2: MTBF = 696/4 = 174 h/failure. Step 3: MTTR = 24/4 = 6 h/repair. Step 4: A = 174/(174 + 6) = 0.9667 = 96.7%. If the mission interval is 168 h, R(168) = e−168/174 = e−0.9655 = 0.381, or 38.1%. Now suppose maintenance reduces the repair count to 2 but each repair takes 12 h, so downtime remains 24 h. Then MTBF = 696/2 = 348 h and MTTR = 24/2 = 12 h. Availability is 348/(348 + 12) = 96.7%, unchanged, while R(168) = e−168/348 = 0.617, or 61.7%. Fewer repairs improved reliability, but not availability, because repair duration offset the gain.
Example 2 — SI units. A pump is required for a 2,000 h campaign. It has 5 functional failures and total downtime of 4 h, or 0.8 h each. In SI, 2,000 h = 7.2 × 10⁶ s and 4 h = 1.44 × 10⁴ s. Uptime = 2,000 − 4 = 1,996 h = 7.1856 × 10⁶ s. MTBF = 1,996/5 = 399.2 h, and MTTR = 4/5 = 0.8 h. Availability = 399.2/(399.2 + 0.8) = 0.998, or 99.8%. For a 720 h mission, R(720) = e−720/399.2 = 0.165, or 16.5%. If the same 4 h downtime came from only 1 repair, MTBF = 1,996 h and MTTR = 4 h; availability remains 99.8%, but R(720) rises to e−720/1996 = 0.697, or 69.7%. The example shows why fewer repairs can improve reliability while leaving availability almost unchanged when total downtime is fixed.
Calculator
For a quick numerical check, use an online availability and MTBF calculator such as calculator.academy/availability-calculator. Record the time boundary, failure definition, planned versus unplanned downtime, and repair delay assumptions before entering numbers; otherwise the result is not auditable.
Reference Values & Typical Ranges
| Metric or range | Typical reference | Engineering note |
|---|---|---|
| Availability, reactive or aging assets | About 90–95% | Often dominated by unplanned failures and long repair delays; compare only with identical event-coding rules [4][5]. |
| Availability, planned-maintenance site | About 95–98% | Spares, planned shutdowns, and repair access strongly influence the result [2][4]. |
| Availability, critical unspared pump | Often above 98% target | Requires condition monitoring, critical spares, and fast restoration; not a guarantee of high MTBF [2][5]. |
| Maintenance share of pump life-cycle cost | About 25% in common examples | Energy is usually larger; maintenance is still large enough to justify reliability programs [2]. |
| MTBF | Duty-specific; no universal value | Mature programs target predictable intervals; abrasive slurry service may be weeks or months, clean service may be years [1][3]. |
| MTTR | Hours to days depending on access and spares | Operational availability includes waiting for parts, permits, and technicians [4][5]. |
Condition monitoring data such as vibration, bearing temperature, seal leakage, and pump performance can extend the potential-failure interval and allow planned intervention. Reliability-centered maintenance divides failures into early-life, random, and wear-out categories; most mature pump programs use this logic to decide which assets need continuous monitoring and which may run to failure [2].
Application Guidance
In real systems, reliability is influenced by pump selection, materials, operating point, suction conditions, slurry derating, vibration, and seal environment. Availability is influenced by all of those plus maintainability: spare-parts stock, technician skill, lifting access, isolation valves, and repair procedures. For unspared critical pumps, both dimensions matter; for spared pumps, a lower-reliability unit may be acceptable if the standby pump and changeover procedure provide adequate availability. Use inherent availability for design comparisons, achieved availability for maintenance-program comparisons, and operational availability for production planning.
Field judgment should distinguish fewer failures from fewer repairs. A pump may show fewer repair events because maintenance is deferred, because small leaks are tolerated, or because condition monitoring is absent and failures are not recorded. Before declaring improvement, verify the failure definition, the observation window, and the downtime taxonomy. Also compare pumps only within similar duties: a clean-water pump and an abrasive slurry pump have different wear mechanisms and cannot be benchmarked on MTBF alone.
Common Mistakes, Limits & Safety Notes
- Treating availability as reliability. A high availability percentage can hide frequent short failures; always pair it with MTBF, MTTR, and failure mode data.
- Using inconsistent denominators. Calendar time, required production time, and scheduled operating time produce different availability values; define the boundary before calculating.
- Not defining functional failure. A pump that still turns but cannot meet required flow, head, containment, or efficiency may be unreliable even if it is not broken down.
- Ignoring planned downtime and logistics. Operational availability must include waiting for spares, permits, cranes, and technicians; inherent availability alone can overstate readiness.
- Mixing time units. Hours, days, seconds, and percentages must be handled consistently; convert to one unit before dividing.
- Using exponential reliability for wear-out. Bearing fatigue, erosion, and seal wear are not constant-rate failures; use Weibull or condition-based models.
- Confusing fewer repairs with better maintenance. Reduced repair counts may reflect deferred work, missing data, or longer repair events, not improved asset health.
- Safety consequence. Deferring repairs to improve a metric can increase leakage, pressure-boundary risk, chemical exposure, fire risk, and unplanned release; never trade safety for availability numbers.
FAQ
What is the difference between pump availability and reliability?
Reliability describes how long a pump is likely to run before a functional failure, often expressed as MTBF or survival probability. Availability describes how much of the required time the pump is ready to run, so it includes both failure frequency and repair speed. A pump can be reliable but unavailable if repairs take too long, or available but unreliable if failures are frequent and short.
Does high availability mean high reliability?
No. High availability can come from fast repairs, generous standby capacity, or short interruptions. A pump with many brief failures may still show high availability while having poor reliability. Always check MTBF, failure count, failure modes, and repair duration alongside the availability percentage.
How is pump availability calculated?
For a defined required-time period, divide uptime by total required time, or use A = MTBF/(MTBF + MTTR) for repairable equipment. State whether planned downtime, standby time, and logistics delays are included. Operational availability includes real-world delays; inherent availability usually covers only failure and repair time.
Why do fewer repairs not always improve availability?
Fewer repairs may raise MTBF, but availability also depends on how long each repair takes. If repair count falls from four to two while total downtime stays at 24 hours, availability can remain unchanged. Longer repairs, missing spares, or delayed permits can offset the reliability gain.
What is a good MTBF for a centrifugal pump?
There is no universal MTBF target. Clean-water process pumps may run for years between failures, while abrasive slurry pumps may need rebuilds in weeks or months. Compare only similar duties and define functional failure consistently. Mature programs look for predictable intervals and stable trends rather than a single benchmark number.
How does condition monitoring improve availability?
Condition monitoring detects deterioration such as rising vibration, bearing temperature, seal leakage, or performance loss before catastrophic failure. That gives planners time to stage parts, tools, and permits and to repair during scheduled downtime. Monitoring does not by itself raise MTBF, but it can shorten unplanned downtime and improve operational availability.
What is operational availability versus inherent availability?
Inherent availability uses MTBF and MTTR and assumes parts, tools, and technicians are ready. Operational availability includes real delays such as waiting for spares, permits, cranes, or production isolation. For production planning, operational availability is usually the more realistic measure.
What data should I track to compare pump reliability and availability?
Track required operating time, uptime, downtime start and end, failure mode, probable cause, repair hours, waiting time, planned versus unplanned status, and spare-parts usage. Use consistent event codes and define functional failure in advance. Without an auditable event taxonomy, availability and MTBF values cannot be compared across pumps or sites.

Leave a Reply